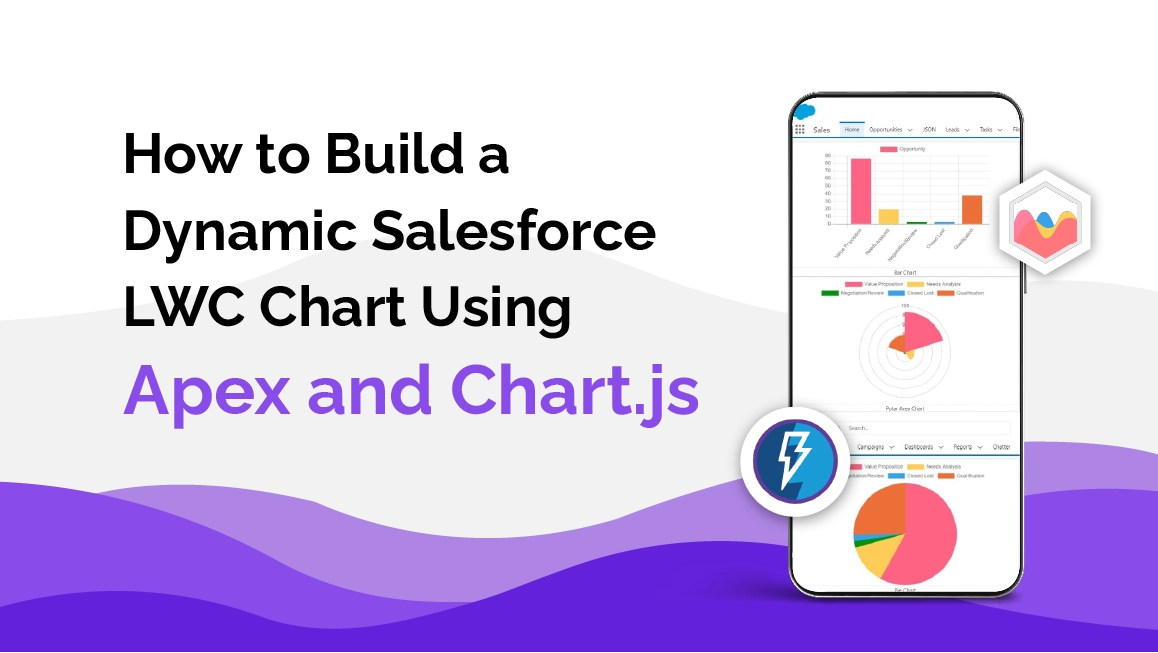
Building a Dynamic Salesforce LWC Chart Using Apex and Chart.js
Introduction
If you’ve ever tried creating something a bit more interactive than a standard Salesforce dashboard, you already know the pain: reports are powerful, but they’re not always flexible. Sometimes you want a chart that reacts instantly, lives inside an LWC, or updates without refreshing the entire page.
That’s where the salesforce lwc chart approach comes in.
Using Apex + LWC + Chart.js, you can build a lightweight, dynamic chart that hooks directly into your CRM data and feels like a modern front-end experience.
We’ll walk through building a reusable component that renders Opportunity pipeline analytics—but you can swap the query for any object.
What This Component Delivers
This reusable chart does the heavy lifting for you:
- Pulls grouped Opportunity data from an Apex method
- Displays it in a bar, line, or doughnut chart
- Lets users switch chart types on the fly
- Loads smoothly without page reloads
- Works for any object with just a small Apex tweak
Step 1 — Build the Apex Controller
This Apex class aggregates Opportunity data and prepares it for the chart.
public with sharing class OpportunityReport {
    @AuraEnabled(cacheable=true)
    public static List<DataSet> getOpportunityRecord() {
        List<AggregateResult> result = [
            SELECT Count(ID) cnt, SUM(Amount) totalAmount, StageName
            FROM Opportunity
            GROUP BY StageName
            LIMIT 10
        ];

        List<DataSet> dataSet = new List<DataSet>();
        for (AggregateResult arr : result) {
            String stage = (String) arr.get('StageName');
            Integer total = (Integer) arr.get('cnt');
            Decimal amount = (Decimal) arr.get('totalAmount');
            dataSet.add(new DataSet(stage, total, amount));
        }

        return dataSet;
    }

    public class DataSet {
        public DataSet(String label, Integer count, Decimal amount) {
            this.label = label;
            this.Count = count;
            this.Amount = amount;
        }
        @AuraEnabled
        public String label { get; set; }
        @AuraEnabled
        public Integer Count { get; set; }
        @AuraEnabled
        public Decimal Amount { get; set; }
    }
}
Step 2 — Add Chart.js as a Static Resource
- Download Chart.js from the official website https://www.chartjs.org/
- Go to Setup → Static Resources → New
- Upload the file with naming conventions like: ChartJS
- Set Cache Control → Public
That’s all you need to make Chart.js globally available for your LWC.
 Step 3 — Create the Parent Component (
opportunityReport)
This LWC pulls data from Apex and passes it to the chart component.
<template>
    <lightning-card title="Opportunity Report">
        <div class="slds-m-around_medium">

            <lightning-combobox
                name="chartType"
                label="Chart Type"
                value={chartType}
                placeholder="Select Chart Type"
                options={chartTypeOptions}
                onchange={handleChartTypeChange}>
            </lightning-combobox>

            <div class="slds-m-top_medium" style="height: 400px;">
                <c-opportunity-chart
                    chart-type={chartType}
                    chart-data={chartData}>
                </c-opportunity-chart>
            </div>

        </div>
    </lightning-card>
</template>
opportunityReport.js
import { LightningElement, wire, track } from 'lwc';
import getOpportunityRecord from '@salesforce/apex/OpportunityReport.getOpportunityRecord';

export default class OpportunityReport extends LightningElement {
    @track opps = [];
    @track chartData = {};
    @track chartType = 'bar';

    // Define options as a property
    chartTypeOptions = [
        { label: 'Bar', value: 'bar' },
        { label: 'Doughnut', value: 'doughnut' },
        { label: 'Scatter', value: 'scatter' },
        { label: 'Line', value: 'line' },
        { label: 'Pie', value: 'pie' },
        { label: 'Radar', value: 'radar' },
        { label: 'Polar Area', value: 'polarArea' }
    ];

    @wire(getOpportunityRecord)
    wiredOppData({ error, data }) {
        if (data) {
            this.opps = data;
            console.log('Apex Data:', data);

            const labels = data.map(item => item.label);
            const counts = data.map(item => item.Count);

            // Important! Clone to remove reactive Proxy
            this.chartData = JSON.parse(JSON.stringify({ labels, counts }));
        } else if (error) {
            console.error('Apex error:', error);
        }
    }

    // Handles dropdown change
    handleChartTypeChange(event) {
        this.chartType = event.detail.value;
        console.log('Chart type changed to:', this.chartType);

        // Force child update
        this.updateChildChart();
    }

    // Sends chart updates to child LWC
    updateChildChart() {
        const chartComp = this.template.querySelector('c-opportunity-chart');
        if (chartComp) {
            chartComp.setChartType(this.chartType);
        }
    }
}
opportunityReport.js-meta.xml
<?xml version="1.0" encoding="UTF-8"?>
<LightningComponentBundle xmlns="http://soap.sforce.com/2006/04/metadata">
    <apiVersion>65.0</apiVersion>
    <isExposed>true</isExposed>
    <targets>
        <target>lightning__AppPage</target>
        <target>lightning__RecordPage</target>
        <target>
        lightning__HomePage</target>
        <target>lightning__Tab</target>
    </targets>
</LightningComponentBundle>
Step 4 — Create the Child Component (opportunityChart)
This LWC actually renders the Chart.js canvas and updates it when chartType changes.
<template>
    <div style="height: 350px;">
        <canvas></canvas>
    </div>
</template>
opportunityChart.js
import { LightningElement, api } from 'lwc';
import chartjs from '@salesforce/resourceUrl/ChartJS';
import { loadScript } from 'lightning/platformResourceLoader';

export default class OpportunityChart extends LightningElement {
    @api chartType = 'bar';
    @api chartData; // expected: { labels: [...], counts: [...] }

    chart;
    chartLoaded = false;

    async renderedCallback() {
        if (this.chartLoaded) return;

        try {
            await loadScript(this, chartjs);
            this.chartLoaded = true;
            console.log('ChartJS Loaded');
            this.renderChart();
        } catch (error) {
            console.error('ChartJS failed to load', error);
        }
    }

    @api
    updateChart() {
        this.renderChart();
    }

    renderChart() {
        if (!this.chartLoaded || !this.chartData) return;

        const canvas = this.template.querySelector('canvas');

        if (!canvas) {
            console.warn('Canvas not found.');
            return;
        }

        // Destroy previous chart if exists
        if (this.chart) {
            this.chart.destroy();
        }

        // Clone to avoid LWC Proxy mutation
        const cleanData = JSON.parse(JSON.stringify(this.chartData));
        const ctx = canvas.getContext('2d');

        this.chart = new Chart(ctx, {
            type: this.chartType,
            data: {
                labels: cleanData.labels,
                datasets: [
                    {
                        label: 'Opportunity Count',
                        data: cleanData.counts,
                        backgroundColor: [
                            '#FF6384', '#36A2EB', '#FFCE56',
                            '#4BC0C0', '#9966FF', '#FF9F40',
                            '#abf583ff', '#f959a4ff', '#116562ff'
                        ],
                        borderWidth: 2
                    }
                ]
            },
            options: {
                responsive: true,
                maintainAspectRatio: false
            }
        });
    }

    // Automatically re-render chart when parent updates properties
    @api
    setChartType(type) {
        this.chartType = type;
        this.renderChart();
    }

    @api
    setChartData(data) {
        this.chartData = data;
        this.renderChart();
    }
}
Final Output
Refresh your Lightning page and—boom—you have a clean, responsive, interactive chart that reacts to user input without a full reload.
Conclusion
If you ever felt boxed in by native Salesforce dashboards, building your own salesforce lwc chart is a game-changer. With Apex supplying the data, LWC controlling the UI, and Chart.js handling the visuals, you get a setup that’s flexible, fast, and surprisingly lightweight.
This same foundation can grow into:
- object-based analytics dashboards
- real-time visual updates
- drill-down reporting
- forecasting charts
- embedded analytics inside flows or custom apps
Once you build one chart this way, you’ll quickly start thinking of ten more use cases. For more, follow The Pinq Clouds AppExchange page.